The allocation of investment capital, both internationally and domestically, is increasingly acknowledged as a leading contributor to a jurisdiction’s economic success or failure. It is, therefore, critical to have objective, empirical measurements that document differences in investment climates.
The Provincial Investment Climate Index is an important step in creating empirical measurements of investment climates. Specifically, the Provincial Investment Climate Index quantitatively evaluates public policies that create and sustain positive investment climates.
The basis of the Index is the Investment Managers Survey (IMS) Series undertaken by The Fraser Institute between 1994 and 2004. The IMS regularly surveyed Canada’s leading money managers on a host of issues, including provincial investment climates and the policies that contributed to positive and negative climates. The policies identified in those surveys (1998–2004) were used to create the Provincial Investment Climate Index.
Provincial Investment Climate Index
The Provincial Investment Climate Index is calculated based on seven measures: Corporate income tax, Fiscal prudence, Personal income tax, Infrastructure, Corporate capital tax, Flexible labour markets, and Regulatory burden. These measures were assessed by the IMS respondents as having an important influence on the creation and maintenance of a positive investment climate.
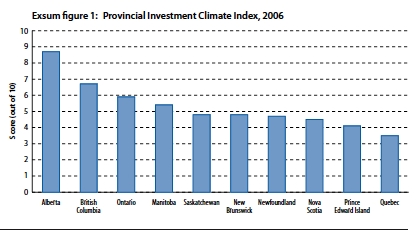
Canada’s two western provinces, Alberta and British Columbia, topped the rankings for the Provincial Investment Climate Index. Alberta ranked first with a score of 8.7 out of 10 and was clearly Canada’s top province [Exsum figure 1, Exsum table 1]. British Columbia followed in second place with a score of 6.7 out of 10. Ontario ranked third with a score of 5.9. Manitoba was the only other province to garner an overall score (5.4) in excess of 5.0. All of the remaining six provinces received scores below 5.0 with Quebec placing last overall with a score of 3.5, indicating it had the most unfavourable investment climate in Canada.

Components of the Provincial Investment Climate Index
A brief description and overview of the results for each of the measures included in the Provincial Investment Climate Index are presented below.
1. Corporate income tax. This component assesses the degree to which provinces tax business profits in the form of corporate income taxes. Quebec received the highest score with a perfect 10.0 out of 10.0. Most jurisdictions performed reasonably well on this component; only Saskatchewan and Newfoundland failed to receive a score above 5.0.
2. Fiscal prudence. Fiscal prudence measures how well provinces have managed their budgets and whether provincial governments are spending in a sustainable manner. Alberta received the highest fiscal prudence score with 9.3 out of a possible 10.0, followed by British Columbia with a score of 7.3. Four other provinces received scores above 5.0: Saskatchewan (6.6), Manitoba (5.8), Ontario (5.4), and New Brunswick (5.2). The remaining four provinces failed to receive a score above 5.0. Prince Edward Island received the lowest score (1.9).
3. Personal income tax. This component measures the personal income tax burden based on income tax rates and the levels of income at which the various rates apply. The three western Canadian provinces (British Columbia, Alberta, and Saskatchewan) dominate this component of the Index. Alberta ranks first with a perfect score of 10.0 out of 10.0. British Columbia, Saskatchewan, and Manitoba followed Alberta with scores of 8.3, 7.5, and 5.0. The other six provinces all received scores below 5.0. Newfoundland received the lowest score (1.5).

4. Infrastructure. This component assesses the transportation infrastructure in each province including road and railroad networks, as well as seaport and airport capacity. Overall, British Columbia ranked first although with a somewhat weak score of 6.7 out of 10. Ontario followed in second place with a score of 6.3. Saskatchewan and Alberta tied in third place with a score of 5.9. Nova Scotia was the only other jurisdiction to receive a score above 5.0. Alarmingly, there were five provinces (Manitoba, Quebec, New Brunswick, Newfoundland and Prince Edward Island) that failed to achieve scores in excess of 5.0. Prince Edward Island ranked last with a score 1.8 out of 10.
5. Corporate capital tax. This component of the Index evaluates the use of corporate capital taxes. Alberta ranked first with the lowest use of corporate capital taxes among Canadian provinces (10.0 out of 10). Most provinces performed reasonably well on this component; only Manitoba, Quebec and Saskatchewan, heavy users of corporate capital taxes, received scores below 5.0. Saskatchewan received the lowest score of 0.4, ranking it last among the provinces.
6. Flexible labour market. Flexible labour markets evaluates the labour laws present in each province based on differences in labour relations laws. Alberta was only one of two provinces to receive a score of 5.0 or higher; it received a score of 7.0 out of a possible 10.0. Ontario was second with a score of 5.0. Quebec, Saskatchewan, and New Brunswick maintained the most rigid labour relations laws in Canada. Quebec had the lowest score of 1.9 and ranked last.
7. Regulatory burden. This component measures the burden of government regulations, often referred to as “red tape.” This measure is based on the recent survey of regulatory costs completed by the Canadian Federation of Independent Business (CFIB). The specific measure used is the estimated regulatory costs as a percentage of the provincial economy. The results are quite striking. Alberta ranked first with a score of 10.0 out of 10.0. However, Alberta’s regulatory costs represent an alarming 2.6% of GDP. Quebec ranked last with regulatory costs representing a worrisome 4.5% of GDP; it received a score of 0.0.
Reconciling the survey and the empirical results
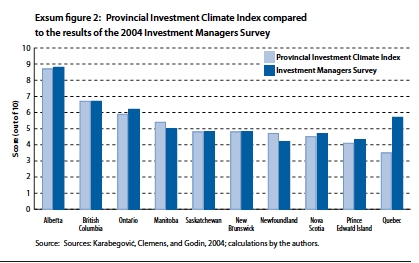
An interesting question addressed in the paper is the relationship between the empirically measured provincial investment climates and those determined subjectively by the survey respondents. The comparison of 2004 survey results with the quantitatively measured results of the Provincial Investment Climate Index indicates a high degree of similarity. Exsum figure 2 highlights the survey scores (2004) as well as the empirically determined scores from the 2006 Provincial Investment Climate Index.
Alberta, British Columbia, and Ontario are the three provinces with the most favourable investment climate in Canada according to both the Provincial Investment Climate Index and the 2004 Investment Manager Survey results.
The most noticeable difference between the results obtained by the Index and the Investment Manager Survey relates to Quebec and Newfoundland. According to the Index, which relies on empirical evidence, Quebec maintains the worst investment climate in Canada. According to the survey, however, Quebec was ranked fourth best in Canada. Conversely, Newfoundland was considered by survey respondents to have the least favourable investment climate in Canada while according to the Index it ranks seventh.
One of the main explanations for this difference is what is referred to as “home bias,” according to which there is a built-in predisposition for domestic or home-based investment due to a greater awareness and understanding (information) of one’s home jurisdiction compared to foreign ones. Thus, the fact that Quebec possesses one of the largest concentrations of financial firms and investors outside Ontario provides a strong explanation for why it performs well on subjective evaluations even though empirically it is shown to be quite weak.

Conclusion
The Provincial Investment Climate Index results indicate that, to varying degrees, all provinces have room to improve their public policies so as to make their jurisdictions more conducive to investment. Provinces are encouraged to continue policies in areas where they performed well and to pursue reforms in areas where they fared pooly.

